Adaptive Fuzzy String Matching
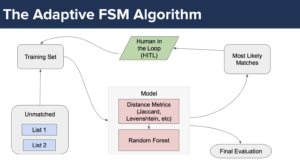 An R library and demo for Adaptive Fuzzy String Matching (Kaufman & Klevs 2021).
R Twitterbot
A minimal working example of a Markov Chain-based (see examples here) Twitterbot in R. The GitHub repository is here.R Shiny Spelling Bee
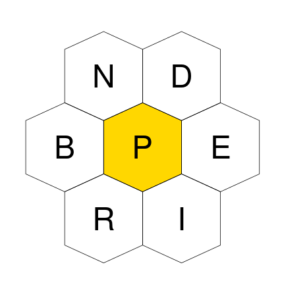 An R Shiny application implementing a version of the Spelling Bee game. The source code is on GitHub.
Compactness
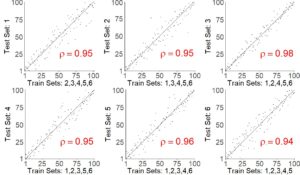 An R package on GitHub to implement the compactness model outlined in Kaufman, King, & Komisarchik (2019).
GraphPruneR
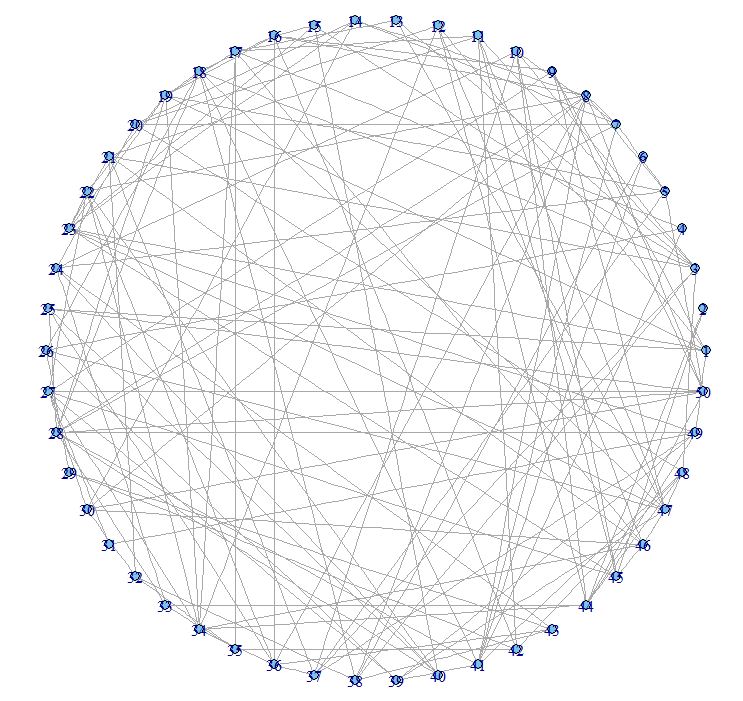
This R script implements the MLF model of pruning network graphs (Dianati 2015). It is compatible with iGraph.
SeqBlock
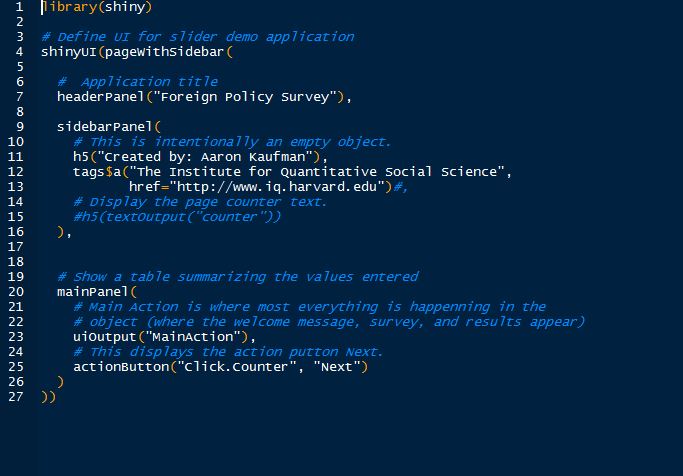
This R Shiny application implements the sequential blocked randomization I wrote with Matthew Kim. In this survey, we replicate Michael Tomz’s 2007 study on audience costs. Respondents first answer 10 demographic questions, are assigned 4 coin-flip confounding treatments, and then assigned to treatment or ontrol based on those 14 covariates. We successfully replicate Tomz’s results
with less than 20% the sample size.
TextBias
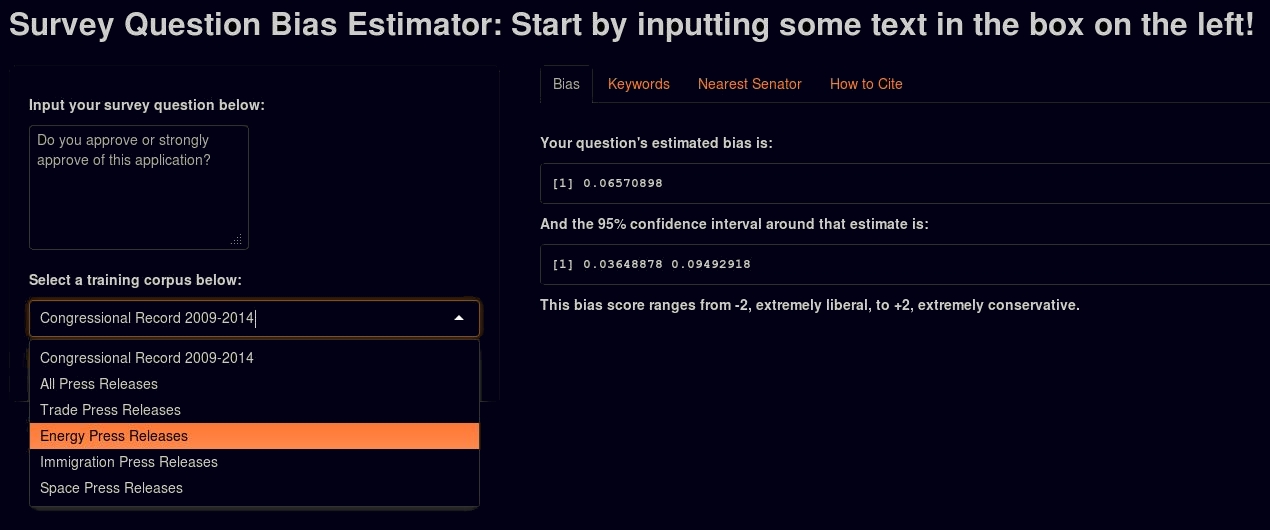
This R Shiny application implements the models implemented in my paper on estimating the partisan bias in survey questions. Input any free text and the application will produce an estimated partisan bias, the most partisan unigrams and bigrams, and the question’s location on the ideological spectrum.
Residual Explorer
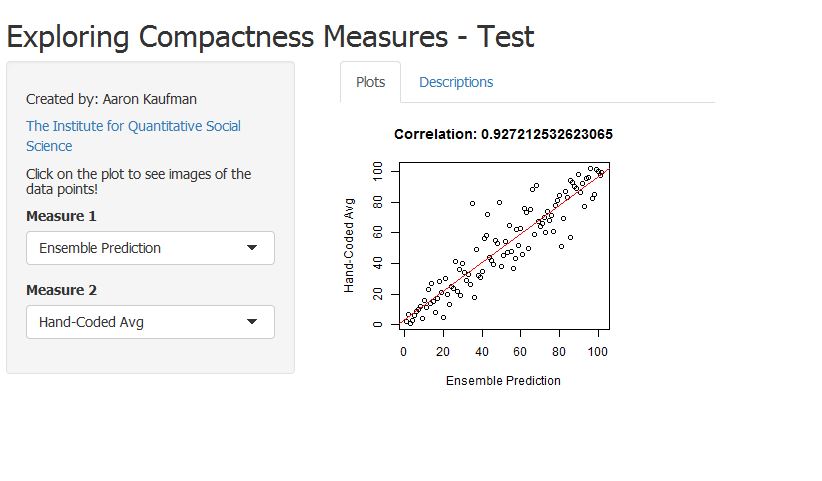
This R Shiny application provides a highly flexible framework for exploring residual values to understand predictive heterogeneity. Two drop-down menus allow the user to select variables to compare. The application draws the 45-degree line, and plots points. Clicking on the plot pulls up a description of that observation.